How to Use a Spectrum Analyzer
Spectrum analyzers are advanced items of test equipment, but can be easy to use with a little practice and understanding.
Spectrum Analyzer Tutorial Includes:
What is a spectrum analyzer
Spectrum analyzer types and technologies
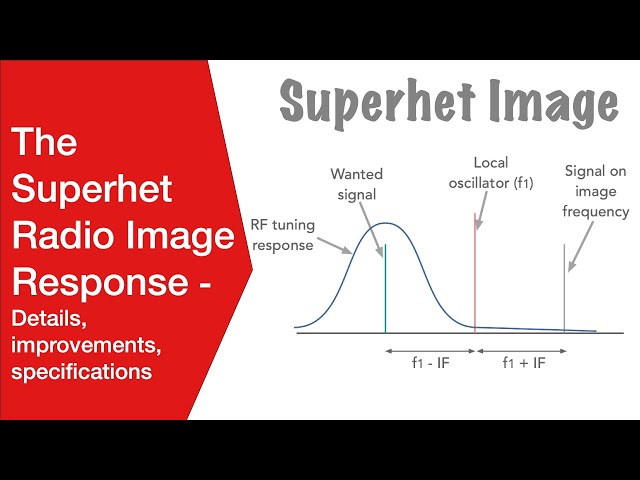
Superheterodyne / sweep spectrum analyzer
FFT spectrum analyzer
Realtime spectrum analyzer
USB spectrum analyzer
Spectrum analyzer tracking generator
Specifications
Spectrum analyzer operation
Noise figure measurements
Phase noise measurements
Pulsed signal spectrum analysis
Spectrum analysers are key test instruments for use when testing radio frequency, RF circuits, modules and units. They are used in many areas including RF design, general electronic circuit design, electronics manufacturing and test, and service and sometimes field repair.
These test instruments display amplitude against frequency and as a result these test instruments are key in locating spurious signals and displaying and measuring signal bandwidths.
Knowing how to use a spectrum analyzer effectively is key to being able to investigate the operation of RF circuits properly.
One of the key ways to understand how to use a spectrum analyzer is to take a look at the controls.
Although this test instrument may look complicated, it can be easy to understand how to use a spectrum analyser once a little time has been spent with one..
Although each analyzer type will be different, the basic concepts are the same across every test instrument - the same types of measurement can be made and the same basic control functions are available. In this way, once one test instrument has been used, the same basic skills can be passed on to the use of other spectrum analyzers.
How to use a spectrum analyzer - the basics
There are a number of different controls and interfaces on a spectrum analyser. Although these pieces of test equipment may appear to be complicated, it is possible to make good use of them after a little practice as it is necessary to use the controls correctly.
The display When looking at how to use a spectrum analyzer, one of the main elements of the test equipment is the display. The display has a graticule which typically has ten major horizontal and ten major vertical divisions.
The horizontal axis of the analyzer is linearly calibrated in frequency with the higher frequency being at the right hand side of the display. The vertical axis is calibrated in amplitude. This scale is normally logarithmic, although it is often possible to have other scales including linear ones for specialised measurements.
A logarithmic scale is normally used because it enables signals over a very wide range to be seen on the spectrum analyser - signals of interest may vary by 70dB, 80dB or more. Typically a value of 10 dB per division is used. This scale is normally calibrated in dBm (i.e. decibels relative 1 milliwatt) and therefore it is possible to see absolute power levels as well as comparing the difference in level between two signals.
In addition to the display of the spectrum, modern analyzers using digital technology often have soft keys to provide various functions around the edge of the display.
Setting the frequency To set the frequency of a spectrum analyser, there are two selections that can be made. These selections are independent of each other and on different controls or entered via a keypad separately:
- Centre frequency: : The centre frequency selection sets the frequency of the centre of the scale to the chosen value. It is normally where the signal to be monitored would be located. In this way the main signal is in the centre of the display and the frequencies either side can be monitored.
- Span: The span selection is the extent of the frequency coverage that is to be viewed or monitored when using the spectrum analyzer. The span may be given as a bandwidth per division on the graticule, or the total span that is seen on the calibrated part of the screen, i.e. within the maximum extents of the calibrations on the graticule. Another option that is often available is to set the start and stop frequencies of the scan. This is another way of expressing the span as the difference between the start and stop frequencies is equal to the span. Reducing the span will allow better resolution of the signal, allowing close in components of the signal to be seen.
- Top and bottom frequencies: : As an alternative to setting the span and the centre frequency, many analysers offer the capability to enter the start and stop or top and bottom frequencies for the sweep.
Gain and attenuation adjustments There are other controls to use on a spectrum analyser. Most of these fall into one of two categories. The first is associated with the gain or attenuation of sections within the spectrum analyzer.
If sections of the test equipment are overloaded, then spurious signals may be generated within the instrument. This can be prevented by including extra attenuation using the input attenuator. However if too much attenuation is inserted, additional gain is required in the later stages (IF gain) and the background noise level is increased and this can sometimes mask lower level signals. Thus a careful choice of the relevant gain levels within the spectrum analyzer is needed to obtain the optimum performance.
Modern test equipment often has a single gain control, normally called the reference level control, that combines the input attenuation and IF gain controls. It automatically adjusts both to obtain the optimum setting. In this way both overload at one end the scale and noise floor at the other end are optimised.
Normally the overall gain is adjusted so that the peak of the signal of interest is placed towards the top of the display - typically a gap of 10dB from the top is a sufficient margin. In this way the spurious and other signals over in amplitude can also be seen very easily.
If the reference level is reduced too far, the signals will reduce in value and get progressively closer to the residual noise level. For reasonable measurements there should be a 20dB difference between the signal and the noise.
Scan rate The spectrum analyser operates by scanning the required frequency span from the low to the high end of the required range. The speed at which it does this is important. Obviously the faster it scans the range the faster the measurement can be made.
However the rate of scan of the test instrument is limited by two other elements. These are the filter that is used in the IF, and the video filter that may also be used to average the reading. These filters must have time to respond otherwise signals will be missed and the measurements rendered useless.
It is still essential to keep the scan rate as high as is reasonably feasible to ensure that measurements are made as quickly as possible. Normally the scan rate, span and the filter bandwidths are linked within the test equipment to ensure the optimum combination is chosen. Scan rate is a key setting especially when large numbers of measurements need to be made, for example in RF design where ICs or RF circuits need to be characterised, or in electronics manufacturer where test times must be kept to a minimum.
- Filter bandwidths The other controls concern the filter bandwidths within the instrument. There are generally two types:
IF filter: The IF filter basic provides the resolution of the spectrum analyzer in terms of the frequency. Choosing a narrow filter bandwidth will enable signals to be seen that are close together. However by the very fact that they are narrow band these filters do not respond to changes as quickly as wider band ones. Accordingly a slower scan rate must be chosen when using them.
When having to use narrow bandwidths and slow scan rates, the time that a measurement can be made by reducing the span that needs to be scanned. Even though a slow scan rate must be used, the range over which the scan must be made can be reduced, thereby reducing the scan time for the analyzer.
Video filter: The video filter function was used with many analogue spectrum analysers and is not commonly seen on those using digital signal processing. It provides a form of averaging to be applied to the signal. This has the effect of reducing the variations caused by noise and this can help average the signal and thereby reveal signals that may not otherwise be seen. Using video filtering also limits the speed at which the spectrum analyser can scan. Modern FFT and realtime spectrum analysers will have a special averaging function.
On modern spectrum analysers the filter bandwidth is normally automatically linked with the span, and scan rate, so that the optimum setting is chosen for any given situation. The narrower the filter, the finer the detail that is seen, and the lower the noise floor level. (NB noise is proportional to bandwidth, so the lower the bandwidth the lower the noise). As mentioned above a good rule of thumb is to ensure that there is a 20dB difference between the noise and the signal level for reasonable measurements.
The filter bandwidth may also be referred to as the resolution in view of the fact that finer detail can be seen with narrower filter bandwidth levels.
Markers: One very useful facility that is incorporated on virtually new spectrum analysers is that of the use of markers. These detect the level of particular portions of the waveform and can be used for measuring the levels of different signals, and comparing figures like the levels of harmonics or spurious signals with respect to the carrier.
Typically these markers can be set to select the peak, second peak and so forth, or to measure the level at a given point - a wheel or knob is generally used to set the frequency for this.
These markers are usually controlled by the soft function keys that are normally present as soft keys on the touch screen, or as buttons around the screen.
Modern spectrum analysers have an enormous number of facilities, especially when compared to the analogue test instruments of many years ago.
In addition to many features like markers, there are normally a host of other features that are accessible by using soft keys. These might include routines for measuring phase noise and noise figure.
Another is the capability for easy testing of signal spectra. A mask can be set up detailing the limits within which the spectrum of a signal must fall. This mask appears on the screen and then it becomes very easy to see if the spectrum of a signal falls outside this.
Hints and tips for using a spectrum analyzer
Although it is possible to detail the various controls one spectrum analyzer and what they do, there are other points relating to the practical side of using a spectrum analyser that are listed below:
Beware of input level: When dealing with high power levels it can be very easy to damage the input of these test instruments. The input is generally connected directly to a high performance mixer. If excessive power is applied, this can destroy the mixer and this can be expensive to fix, let alone the cost of the disruption to any testing whilst a replacement is found.
When testing transmitters the output must be passed through an attenuator, and when re-configuring any test it can be easy to forget to include the attenuator. Be very careful to ensure the attenuator is always included to reduce any high power levels so the input is not overloaded.
The input connector to the analyzer normally has a warning about the maximum power level allowed, detailing the actual powers permissible.Checking whether spurious signals are generated in the analyzer or UUT: When testing for spurious signals, it is not always obvious whether any spurious signals have been generated internally within the test instrument or they are from the unit under test. Spectrum analyzer input stages can generate serious signals if they become overloaded.
The easy way to check is to reduce the input attenuator level (not any other gain controls) by 10 dB. If the spurious levels drop by 10dB (along with the other signals), then the spurious signals are generated by the UUT. If the spurious signals drop by more than 10 dB it means that they are generated internally within the spectrum analyzer. If this is the case, reduce the input attenuator until the spectrum analyzer generated spurious signals are no longer visible.
- Ensure the software is up to date: It is always best to ensure that the software within the spectrum analyzer is up to date. Manufacturers periodically update the software to fix bugs and sometimes to enhance the performance. By keeping the software up to date, it is possible to ensure all the latest facilities are available.
- When measuring phase noise ensure the analyzer performance is adequate: When measuring the phase noise of a signal using a spectrum analyzer, ensure that the noise performance of the local oscillator within the spectrum analyzer is around 6 dB better than that of the expected performance of the signal under test. If this is not so, then the phase noise of the spectrum analyzer oscillator will affect the readings. If the extreme case where the signal under test is better than that of the spectrum analyzer local oscillator, the phase noise of the spectrum analyzer itself is measured!
When using a spectrum analyzer it is quickly possible to get to a place where it can be used effectively. Some of the hints and tips on using these test isntruments help overcome issues that everyone encounters when using spectrum analyzers.
Although most spectrum analysers will have further controls, the ones mentioned are the main ones that are used and will enable a good understanding of how to use a spectrum analyzer. Spectrum analyzers are very useful items of test equipment and they are invaluable for RF design, development and test.
Spectrum analysers are invaluable test instruments for RF design - they provide essential insights into the operation of RF circuits, modules and systems. As such they are one of the most important items of test equipment for RF design, electronic circuit design, electronics manufacturing, service, field repair, etc..
More Test Topics:
Data network analyzer
Digital Multimeter
Frequency counter
Oscilloscope
Signal generators
Spectrum analyzer
LCR meter
Dip meter, GDO
Logic analyzer
RF power meter
RF signal generator
Logic probe
PAT testing & testers
Time domain reflectometer
Vector network analyzer
PXI
GPIB
Boundary scan / JTAG
Data acquisition
Return to Test menu . . .