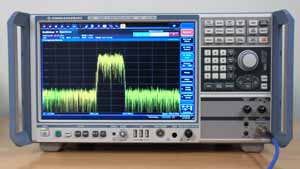
FFT Spectrum Analyzer
Fast Fourier Transform spectrum analyzers are a type of RF test equipment using digital signal processing for improved performance in RF design, test, service & repair.
Spectrum Analyzer Tutorial Includes:
What is a spectrum analyzer
Spectrum analyzer types and technologies
Superheterodyne / sweep spectrum analyzer
FFT spectrum analyzer
Realtime spectrum analyzer
USB spectrum analyzer
Spectrum analyzer tracking generator
Specifications
Spectrum analyzer operation
Noise figure measurements
Phase noise measurements
Pulsed signal spectrum analysis
The FFT or Fast Fourier Transform spectrum analyser is now being used increasingly to improve performance reduce costs in RF design, electronics manufacturing test, service, repair.
With increasing use of wireless technology used in the electronic circuit design of electronic devices, improved performance from spectrum analyzers is growing in importance.
As the name suggests the FFT spectrum analyzer is an item of RF test equipment that uses Fourier analysis and digital signal processing techniques to provide spectrum analysis.
Using Fourier analysis any waveform in the time domain can be represented by the weighted sum of sine and cosine signals. Using this concept, the FFT spectrum analyzer samples the input signal. It then computes the magnitude of its sine and cosine components of the overall signal, and finally it displays the spectrum of the signal.
The FFT spectrum analyzer is able to provide facilities that cannot be provided by swept frequency analyzers. They can provide fast capture and analysis of waveforms in a way that cannot be achieved with sweep / superheterodyne techniques alone.
The signals can be displayed, stored, and processed to provide more insight into the signal and its characteristics, enabling the engineers undertaking RF design of the electronic devices to understand the signals in more depth.
As many test instruments use a digital approach to signal processing and control, it is hardly surprising to see that spectrum analysers also use this technology, reaping significant benefits in terms of performance and convenience.
Fast Fourier Transform - FFT analyser basics
The concept of the FFT spectrum analyzer is built around the Fast Fourier Transform which is based on a technique called Fourier analysis, developed by Joseph Fourier (1768 - 1830). Using his transform it is possible for one value in, for example, the continuous time domain to be converted into the continuous frequency domain, in which both magnitude and phase information are included.
To capture a waveform digitally it is necessary to capture a series of successive discrete values at regular intervals in the test equipment. As the time domain waveform is taken at time intervals, it is not possible for the data to be converted into the frequency domain using the standard Fourier transform. Instead a variant of the Fourier transform known as the Discrete Fourier Transform, DFT must be used.
As the DFT uses discrete samples for the time domain waveform, this reflects into the frequency domain and results in the frequency domain being split into discrete frequency components or "bins."
The number of frequency bins over a frequency band is the frequency resolution. To achieve greater resolution, a greater number of bins is needed, and hence in the time domain a large number of samples is required.
As can be imagined, this results in a much greater level of computation, and therefore methods of reducing the amount of computation required is needed to ensure that the results are displayed in a timely fashion, although with today's vastly increased level of processing power, this is less of a problem.
To ease the processing required, a Fast Fourier Transform, FFT is used. This requires that the time domain waveform has a the number of samples equal to a number which is an integral power of two.
Within the test instrument, the input signal is digitized at a high sampling rate. The Nyquist theorem states that as long as the sampling rate is greater than twice the highest frequency component of the signal, the sampled data will accurately represent the input signal.
FFT spectrum analyzer basics
The block diagram and topology of the FFT analyzer test equipment are different to that of the more usual superheterodyne or sweep spectrum analyzer. In particular circuitry is required to enable the digital to analogue conversion to be made, and then for processing the signal as a Fast Fourier Transform.
Nevertheless, analogue preconditioning is still enquired to ensure that the signal reaching the analogue to digits conversion is within the correct range and any other analogue processing that may be required has been undertaken.
The FFT spectrum analyzer can be considered to comprise of a number of circuit different blocks:

Analogue front end attenuators / gain: The test instrument requires stages at the input of the FFT analyser to ensure that the signal is at the required level for the analogue to digital conversion. These stages may provide either gain or attenuation. If the signal level is too high, then clipping and distortion will occur, too low and the resolution of the ADC and noise become a problems.
Matching the signal level to the analogue to digital converter, ADC range ensures the optimum performance and maximises the resolution of the ADC. Often the control of the gain will be controlled by the test instrument control processor.
Analogue low pass anti-aliasing filter: The signal is passed through an anti-aliasing filter. This is required because the rate at which points are taken by the sampling system within the FFT analyzer is particularly important.
The waveform must be sampled at a sufficiently high rate. According to the Nyquist theorem a signal must be sampled at a rate equal to twice that of the highest frequency, and also any component whose frequency is higher than the Nyquist rate will appear in the measurement as a lower frequency component - a factor known as "aliasing". This results from the where the actual values of the higher rate fall when the samples are taken. To avoid aliasing a low pass filter is placed ahead of the sampler to remove any unwanted high frequency elements.
This filter must have a cut-off frequency which is less than half the sampling rate, although typically to provide some margin, the low pass filter cut-off frequency is at highest 2.5 times less than the sampling rate of the analyzer. In turn this determines the maximum frequency of operation of the overall FFT spectrum analyzer.
Sampling and analogue to digital conversion: In order to perform the analogue to digital conversion, two elements are required. The first is a sampler. This takes samples at discrete time intervals: this is called the sampling rate.
The importance of this rate has been discussed above. The samples are then passed to an analogue to digital converter, ADC which produces the digital format for the samples that is required for the FFT analysis.
FFT analyzer: The data from the sampler is in the time domain but it is converted into the frequency domain by the FFT analyzer. This is then able to further process the data using digital signal processing techniques to analyze and process the data so that it can then be passed to the display to give the required display.
Display: With the power of processing it is possible to present the information for display in a variety of ways. Displays are very flexible and enable the information to be presented in formats that are easy to comprehend and reveal a variety of facets of the signal. The display elements of the FFT spectrum analyzer are therefore very important so that the information captured and processed can be suitably presented for the user.
In addition to actually displaying the signal, the display often has many controls around to to provide a considerable degree of flexibility and additional soft-functions.
In operation the test instrument will take a sample at set times, and then this will be processed before passing it to the display.
There will be a given amount of time between samples, and this can be likened to the time between scans of a traditional swept superheterodyne spectrum analyzer.
It should be noted that the time interval between successive samples is likely to be very much shorter than that experienced by a swept analyzer passing the same frequency again.

In view of the amount of processing required to achieve the required signal processing, most FFT spectrum analyzers will use FPGAs (field programmable gate arrays) as they are able to be configured to provide very fast signal processing.
Advantages and disadvantages of FFT analyzer technology
As with any form of technology, FFT analysers have their advantages and disadvantages:
Advantages of FFT spectrum analyzer technology
Fast capture of waveform: In view of the fact that the waveform is analysed digitally, the waveform can be captured in a relatively short time, and then the subsequently analysed. This short capture time can have many advantages - it can allow for the capture of transients or short lived waveforms.
The fast capture of waveforms by this type of test instrument can be used in many areas: characterising a new RF design, be it an integrated circuit, or an electronics circuit design using many components. The higher speed can enable a far greater number of measurements to be taken in a short time, and computer controlled. It can also be used within electronics manufacturing, where measurement speed is important to ensure a high production rate.
- Able to capture non-repetitive events: The short capture time means that the FFT analyzer can capture non-repetitive waveforms, giving them a capability not possible with other spectrum analyzers.
- Able to analyse signal phase: As part of the signal capture process, data is gained which can be processed to reveal the phase of signals. With various forms of phase based modulation schemes being used for digital communications, the ability to capture phase information in this test instrument can be particularly useful.
- Waveforms can be stored Using FFT technology, it is possible to capture the waveform and analyse it later should this be required. For storing waveforms, considerable amounts of memory may be required, especially if repeated waveforms are to be stored. However with memory being relatively cheap, this is not a major problem - the real issue is to ensure that the system has sufficient memory available, either within the test equipment itself, or within any associated computer.
Disadvantages of the FFT spectrum analyzer technology
Frequency limitations: The main limit of the frequency and bandwidth of FFT spectrum analyzers is the analogue to digital converter, ADC that is used to convert the analogue signal into a digital format.
It is this component that places the major limitation on the bandwidth as a result of the ADC top frequency. Also ADCs with more bits tend to have lower frequency limits. As a result of this superheterodyne techniques are often combined with the FFT approach to obtain a more versatile instrument with higher frequency and bandwidth limits.
- Cost: Cost used to be an issue, but is not a problem these days. Initially FFT analysers were far more expansive than their analogue counterparts. However with processing technology now being cheaper, FFT analysers are now commonplace and virtually all new spectrum analysers use a digital approach with FFT technology.
In many instances superheterodyne and FFT techniques are used in single spectrum analyzer. This enables the best of both techniques to be adopted to provide a truly versatile and high performance test instrument.
Essentially the superheterodyne technique may be used to convert the frequency down to an intermediate frequency where the analogue to digital conversion can take place. The RF test instrument then uses FFT signal processing techniques in the normal way.
However, with analogue to digital conversion technology improving significantly in speed, the the need for conversion of the signals is being confined to the very much higher frequencies.
In view of the low cost of processing circuitry, most new RF spectrum analyzers these days adopt the FFT approach along with a significant amount of control processing to enable the test instrument to have a high degree of RF performance along with many capabilities.
These spectrum analyzers are used in many areas from general electronics circuit design, RF design, electronics manufacturing, service and repair, etc. These test instruments offer a much higher level of performance than the older swept or superheterodyne spectrum analyzers, and as a result FFT spectrum analyzers are now used in most applications.
More Test Topics:
Data network analyzer
Digital Multimeter
Frequency counter
Oscilloscope
Signal generators
Spectrum analyzer
LCR meter
Dip meter, GDO
Logic analyzer
RF power meter
RF signal generator
Logic probe
PAT testing & testers
Time domain reflectometer
Vector network analyzer
PXI
GPIB
Boundary scan / JTAG
Data acquisition
Return to Test menu . . .